
Blog
Do You Think You Have a Mobile Conversion Issue? – Calculate Your own Rel. cMvR
27th Oct, 2019

Chris Green
“Mobile traffic converts worse” is a statement which anyone working in digital for a while is used to hearing.
Generally speaking, desktop devices were always considered the device that people will make a purchase on, not mobile. This hasn’t been the case for months/years now and people are finally starting to appreciate the importance of optimising their mobile sites for better conversion rates.
How exactly you do this can be a challenge, but there are a handful of useful reports/metrics which can help. Lina Hansson, a conversion specialist at Google wrote about one interesting method recently by “monitor[ing] your mobile website performance by reviewing your Relative Mobile Conversion Rate (Rel mCvR)”.
If you want a simple number to understand how good/bad your mobile site is working for you, read on!
Click here to calculate it for yourself
How do I Calculate My Relative Mobile Conversion Rate?
The eagle-eyed amongst you may have noticed this isn’t a metric already reported in Google Analytics, which means you’re going to have to calculate it yourself.
It’s pretty simple:
Rel. cMvR = Mobile Conversion Rate (%) / Desktop Conversion Rate (%)
If you want to use it regularly, however, this may be a pain to keep on top of, so with the help of Al Wightman & Lee Hurst I have rustled up a version in Data Studio.
- Click this link > https://datastudio.google.com/u/0/reporting/844d7745-6022-4116-806b-5e31da0a44b9
- Copy the report and hook up your own GA Account
- That’s it!
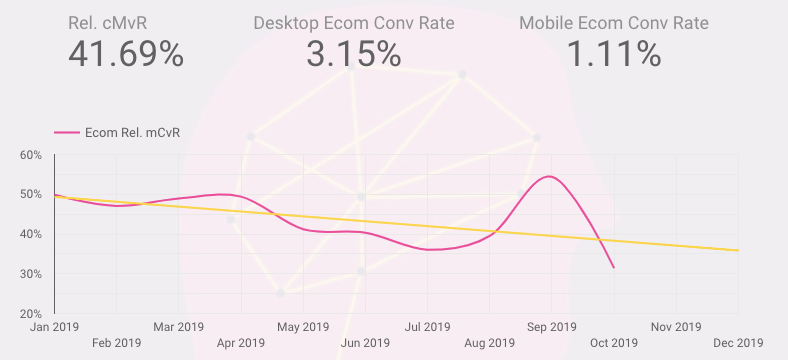
The ecommerce tab will only work where you have revenue data in GA and the “All Goals” literally uses GA’s “goal conversion rate” metric. But what you’ll see is your relative mobile conversion rate against the Desktop & Mobile stats (the yellow line represents the trend).
Beneath this I have also included Google Analytic’s own simplified page speed metric – it’s not perfect by any means, but if the issue is likely related to the speed of your mobile site, this is the first place to look!
If you are tracking some less useful goals in GA you may need to create your own calculated metric to only include those goals OR you can build a Rel. cMvR for each of the goals which are of value and report on them separately.
What do you use Rel. cMvR for?
Understanding – quickly – how the mobile version of your site is performing relative to desktop. If anyone spends a lot of time analysing conversion rates on their website they should already have a picture of this. It is incredibly valuable for providing this insight in a single metric which:
- Gives a relative score which isn’t subject to campaign/traffic in the same way of looking a mobile & desktop conversion rates in isolation
- Can be reported on weekly to monitor conversion rate optimisation
- Can be used to make a case for improving known issues on the website (namely page-speed!)
It’s not a perfect metric (what is?) and it shouldn’t be used in isolation, but it is small-yet-mighty for those people who have to monitor many things at once.
What is a Good Rel. cMvR?
There’s no right or wrong here, however, we can establish some bands of what “good looks like” as a way of understanding how to prioritise actions from here.
As a guide:
- – <50% = Poor
- – 50%-70% = Average*
- – 70%> = Good
- – 100%> = Mobile wins
Anything under 50% should generally considered a cause for concern – time to prioritise your mobile user experience!
What Impacts Rel. cMvR?
This conversion rate, being relative, is most often impacted by device-specific factors. Part of the reason behind using it is that campaign/traffic-level influences are minimised (assuming they impact mobile & desktop equally), so what’s left can be used to set actions to trouble-shoot any poor performance.
- Site speed – Often sees some of the greatest increases of this ratio as speed heavily correlates with mobile conversion. This is pretty well known but it’s worth pointing out again that mobile experiences are slower and “slower” correlates well with lower conversion rates. Rel. cMvR helps us to understand if this is a significant problem quickly.
- Device-based technical issues – If you suffer usability/technical issues across either mobile or desktop, this will heavily alter this ratio. In fact Rel. cMvR scores which are drastically low (<10%) or really high (500%>) could be suggestive of a wider problem unique to a device-type that you may not have noticed.
- General usability – At a risk of sounding too broad the difference between desktop & mobile conversion rate is around the usability issues (inclusive of points 1 &2), this metric is a measure of that. The key question you have to come back in the end is, “is it as easy to purchase with a thumb on a 7′ screen as it is with a keyboard & mouse sat at a desk?”
- Low Conversions – As this metric is a percentage, having a low number of conversions will heavily impact the score over time as even a small increase/decrease in conversion could take a score from 20% to 120%. You can try and adjust for this by measuring over a longer period of time and charting a trend in the data.
What Impacts Rel. cMvR leads us on to ways of fixing/addressing this.
“Fixing” a Low Rel. cMvR
For something to need fixing there must be a problem first – this isn’t always the case with Rel. cMvR. There are many other reasons why you might expect a low percentage here. Websites with physical stores for example, may struggle for a high % ratio (over 70%) – start investing possible reasons for a low relative conversion rate before you get too anxious, there might be a simple explanation.
- – Improving site speed is the most frequent way of addressing a low Rel. cMvR. You’re probably sick of people telling you speed is important, however, many still don’t take this seriously enough.
- – Review the user journey on mobile & desktop devices, highlight where there are points of friction. Focus on addressing those which are unique to mobile.
- – A/B Testing on key conversion touch points if you think you’ve identified the area which is causing problems. The Rel. cMvR will reflect any performance benefits relatively quickly.
Finally, the Rel. cMvR may fluctuate over time (go up AND down), however, it’s important to check back periodically & track the overall trend. This is to ensure that any changes are taking effect and you trouble-shoot other potential issues which you weren’t aware of, or may have arisen since.
Do you have Mobile Conversion Issue?
Quite possibly, but don’t feel bad – most do.
One way to always look at data/findings like this is that identifying the problem is the most important step. You can’t fix what you’re not aware of!
If you’ve got any questions about the process, the metric or feedback on the Data Studio report itself, you can contact us here.